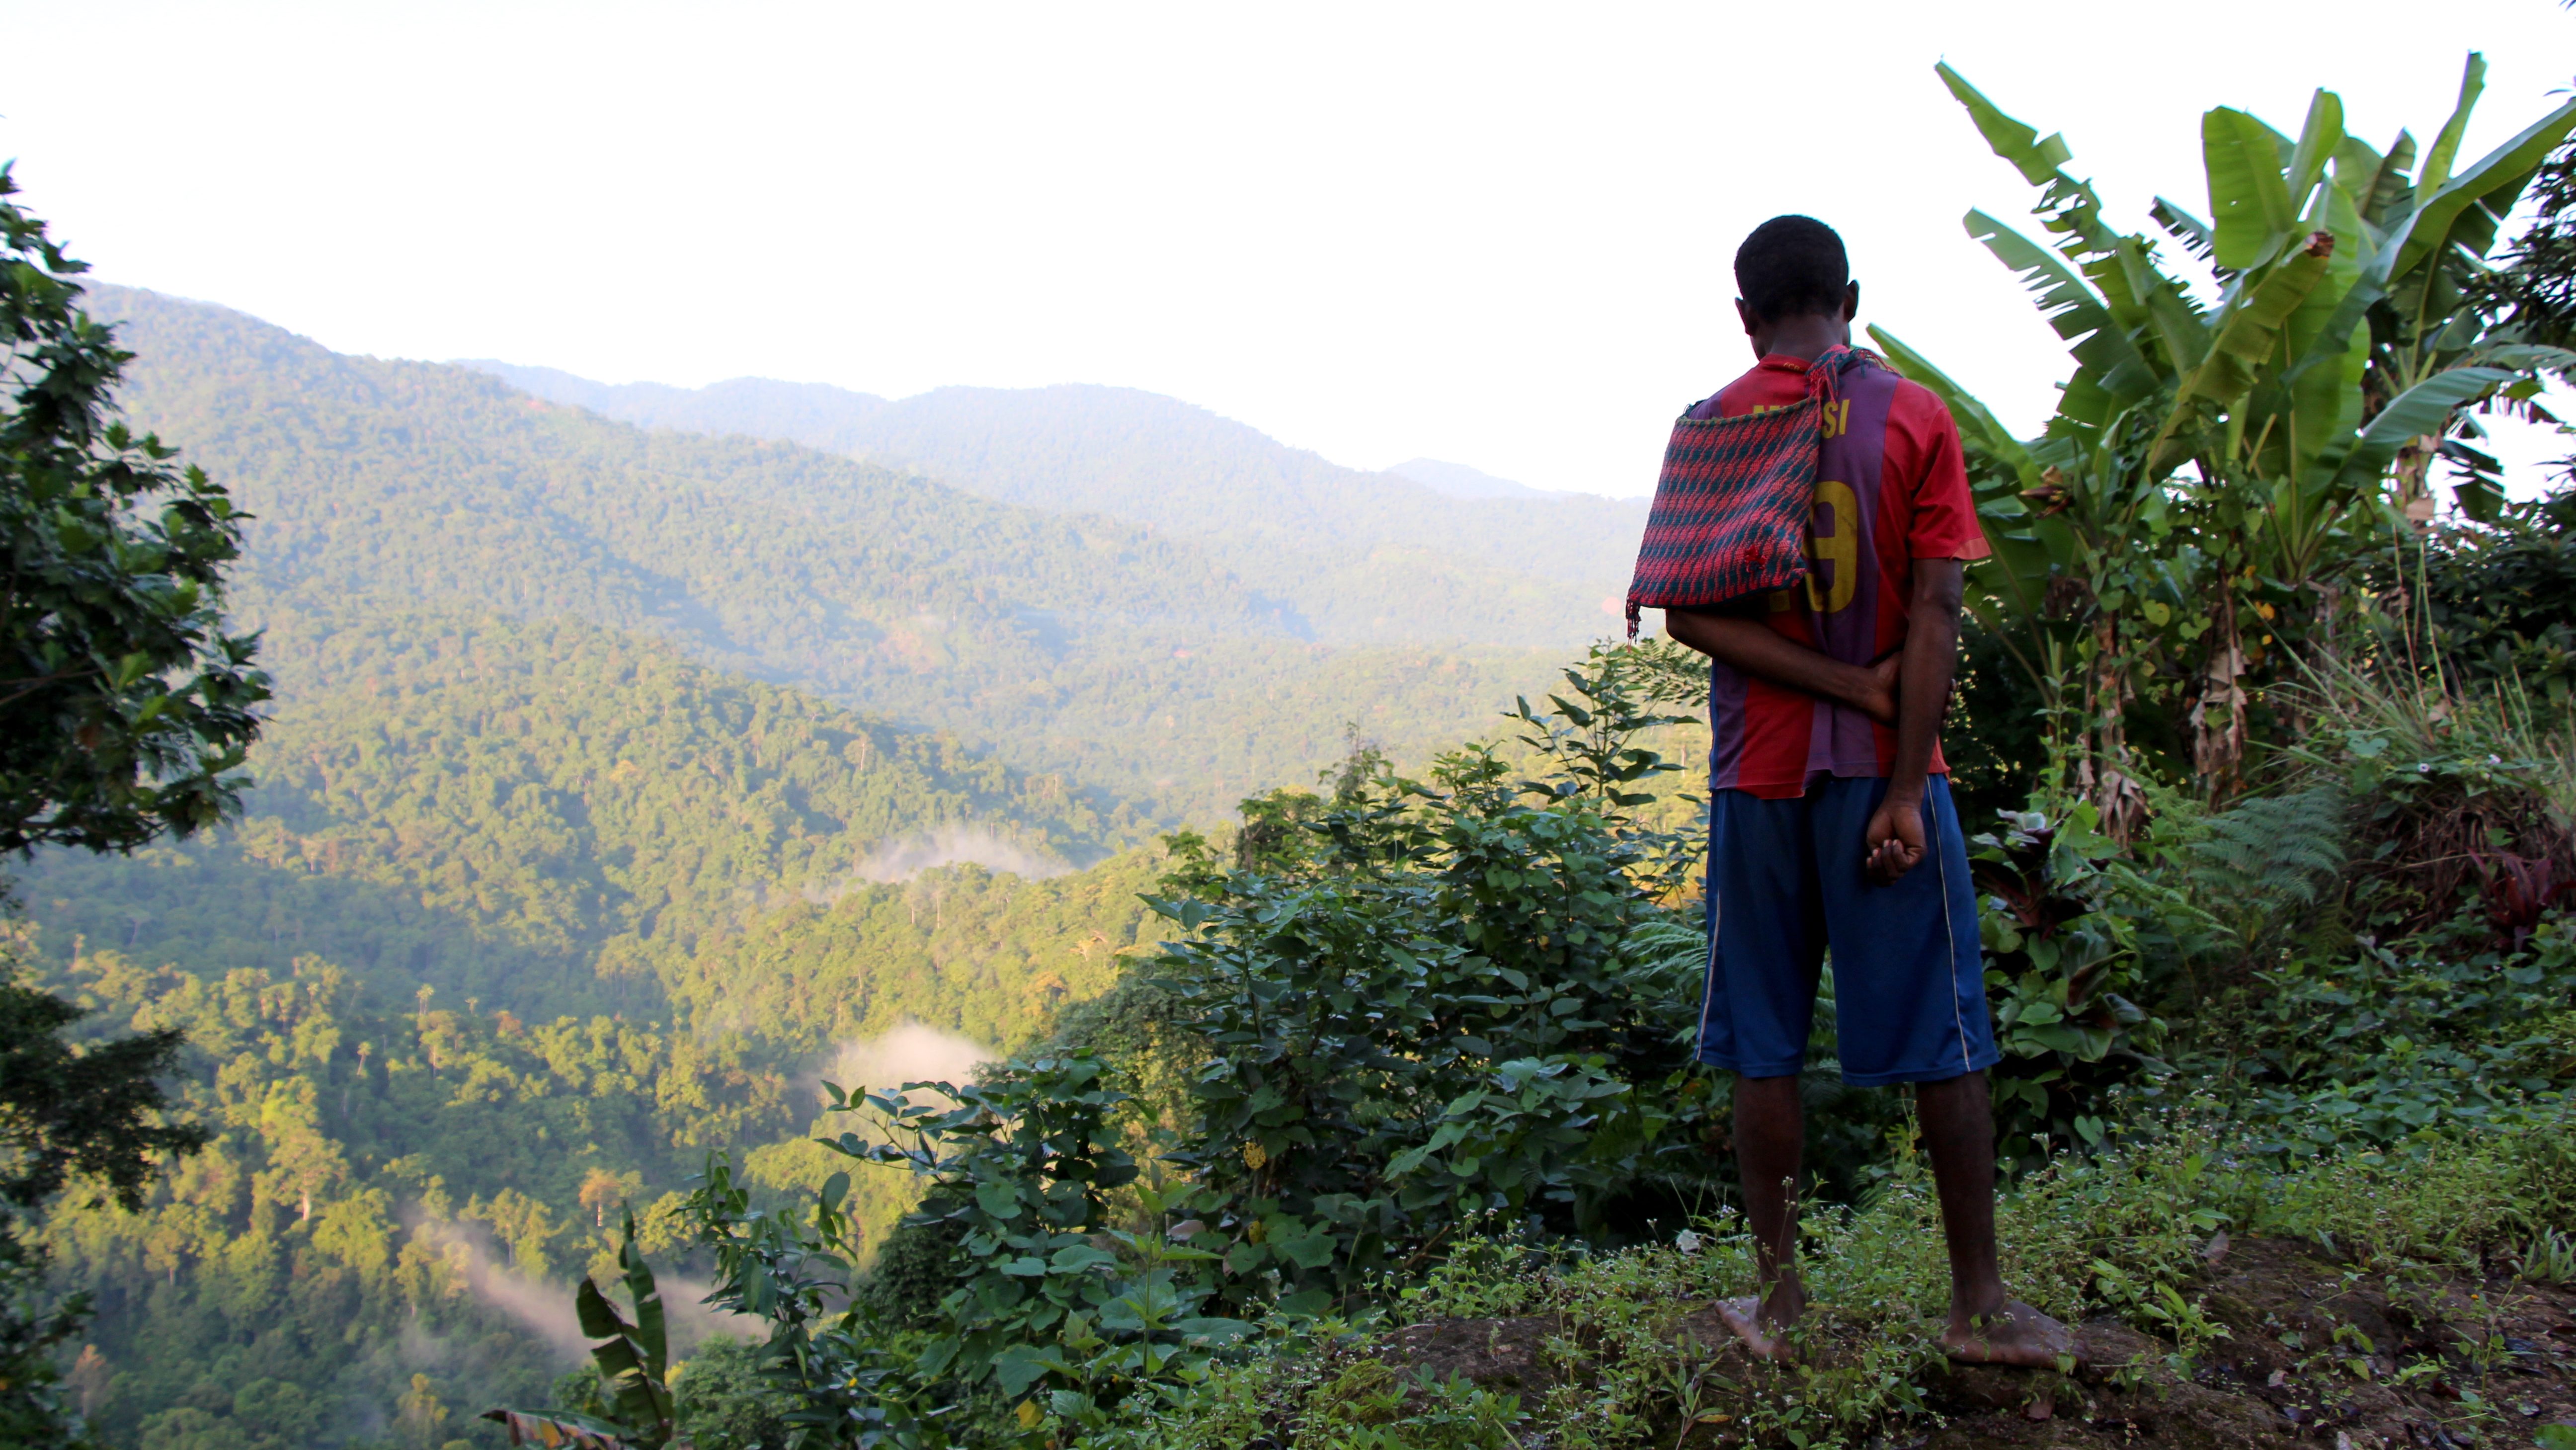
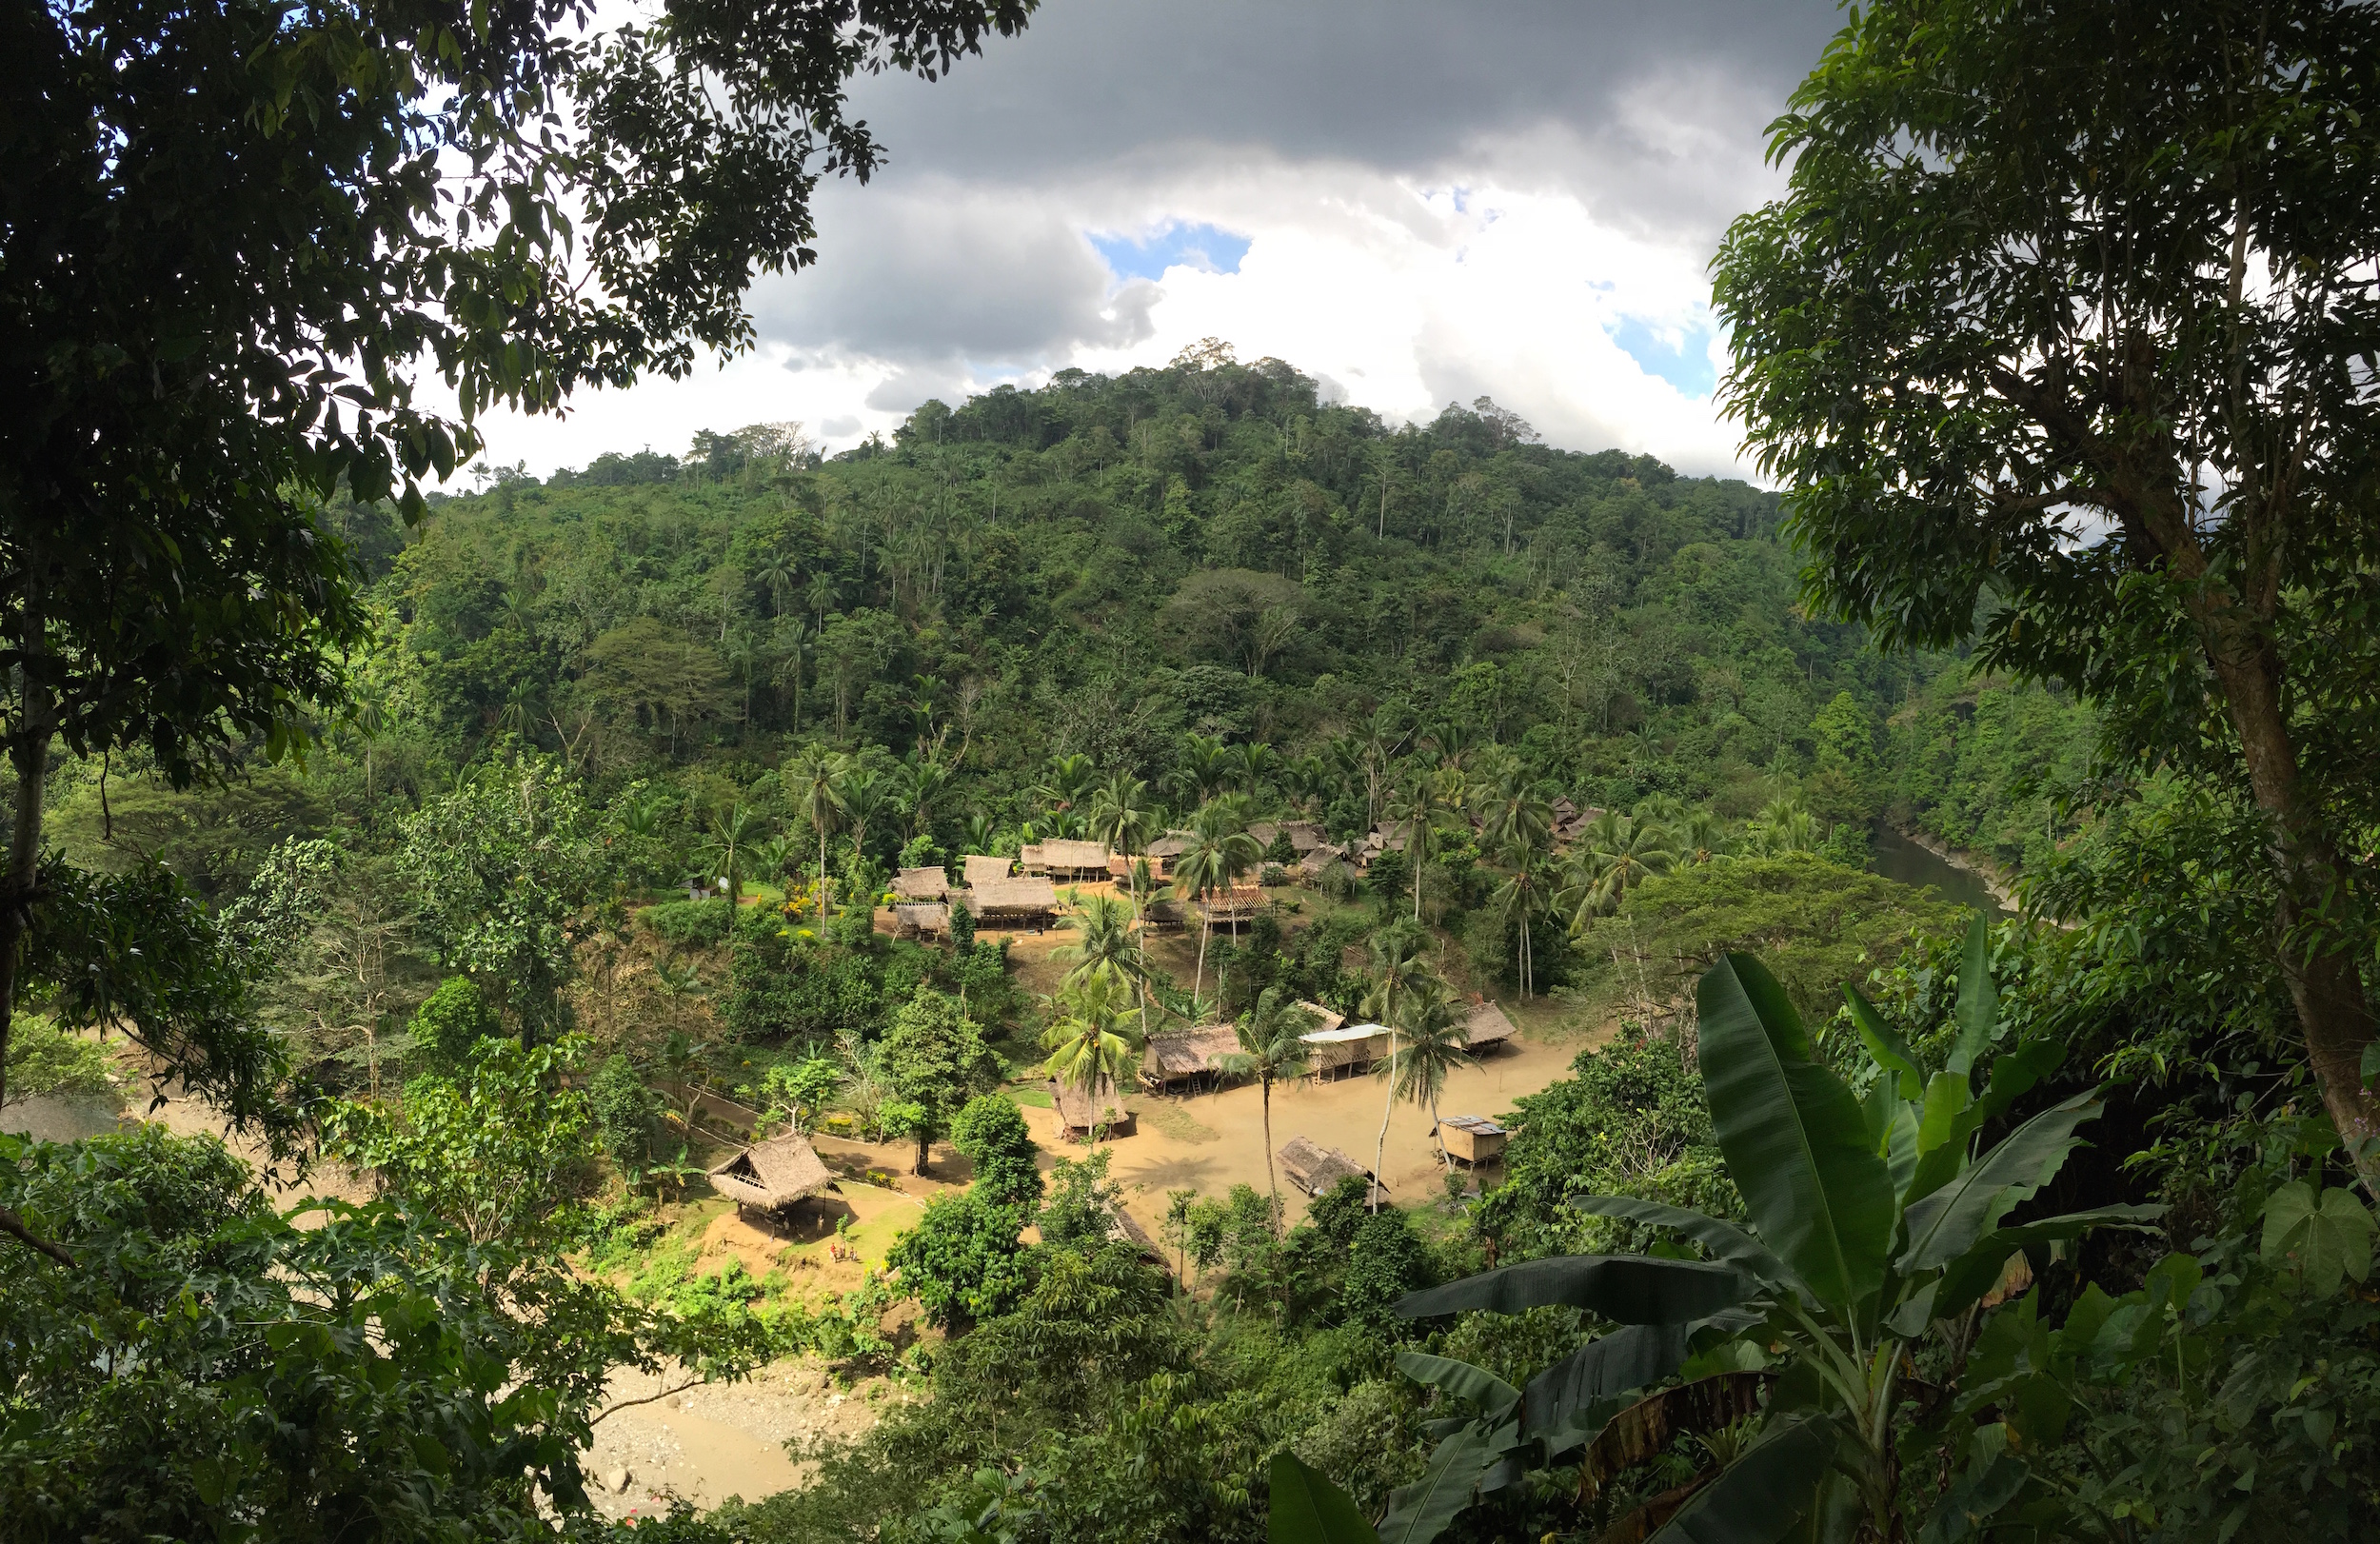
Morning in Musiamunat village. Across the river and up a steep mountainside, birds-of-paradise call raucously through the rainforest canopy, adding their calls to the nearly deafening insect chorus. Less than a kilometer away, small birds flit through a grove of banana trees, taro and pumpkin vines winding across the rough clearing. Here too, the cicadas howl.
To the ear, both garden and forest are awash with noise. But hidden within this dawn chorus are clues to the forest’s health.
New acoustic research from Nature Conservancy scientists indicates that forest fragmentation drives distinct changes in the dawn and dusk choruses of forests in Papua New Guinea. And this innovative method can help evaluate the conservation benefits of land-use planning efforts with local communities, reducing the cost of biodiversity monitoring in the rugged tropics.
When Biodiversity Is A Bar to Entry
For conservation projects, high biodiversity can be an Achilles heel. In tropical rainforests, like Papua New Guinea, it requires a tremendous amount of expertise to rigorously measure and monitor the wealth of species. And without this data, conservationists have no way of knowing if their efforts — and their financial investments — are paying off.
The added challenge in Papua New Guinea is that 95 percent of the land is held under customary tenure, or traditional ownership, meaning that conservation can only work from the group up, one village at a time. For communities without consistent access to basic resources, like soap and clean water, accessing the technical expertise needed to monitor biodiversity is effectively impossible.
“It’s one thing for a community to say that they cut fewer trees, or restricted hunting, or set aside a protected area, but it’s very difficult for small groups to demonstrate the effectiveness of those efforts,” says Eddie Game, The Nature Conservancy’s lead scientist for the Asia-Pacific region.
Aside from the ever-present logging and oil palm, another threat to PNG’s forests is subsistence agriculture, which feeds a majority of the population. In the late 1990s, The Nature Conservancy worked with 11 communities in the Adelbert Mountains to create land-use plans, dividing each community’s lands into different zones for hunting, gardening, extracting forest products, village development, and conservation. The goal was to limit degradation to specific areas of the forest, while keeping the rest intact.
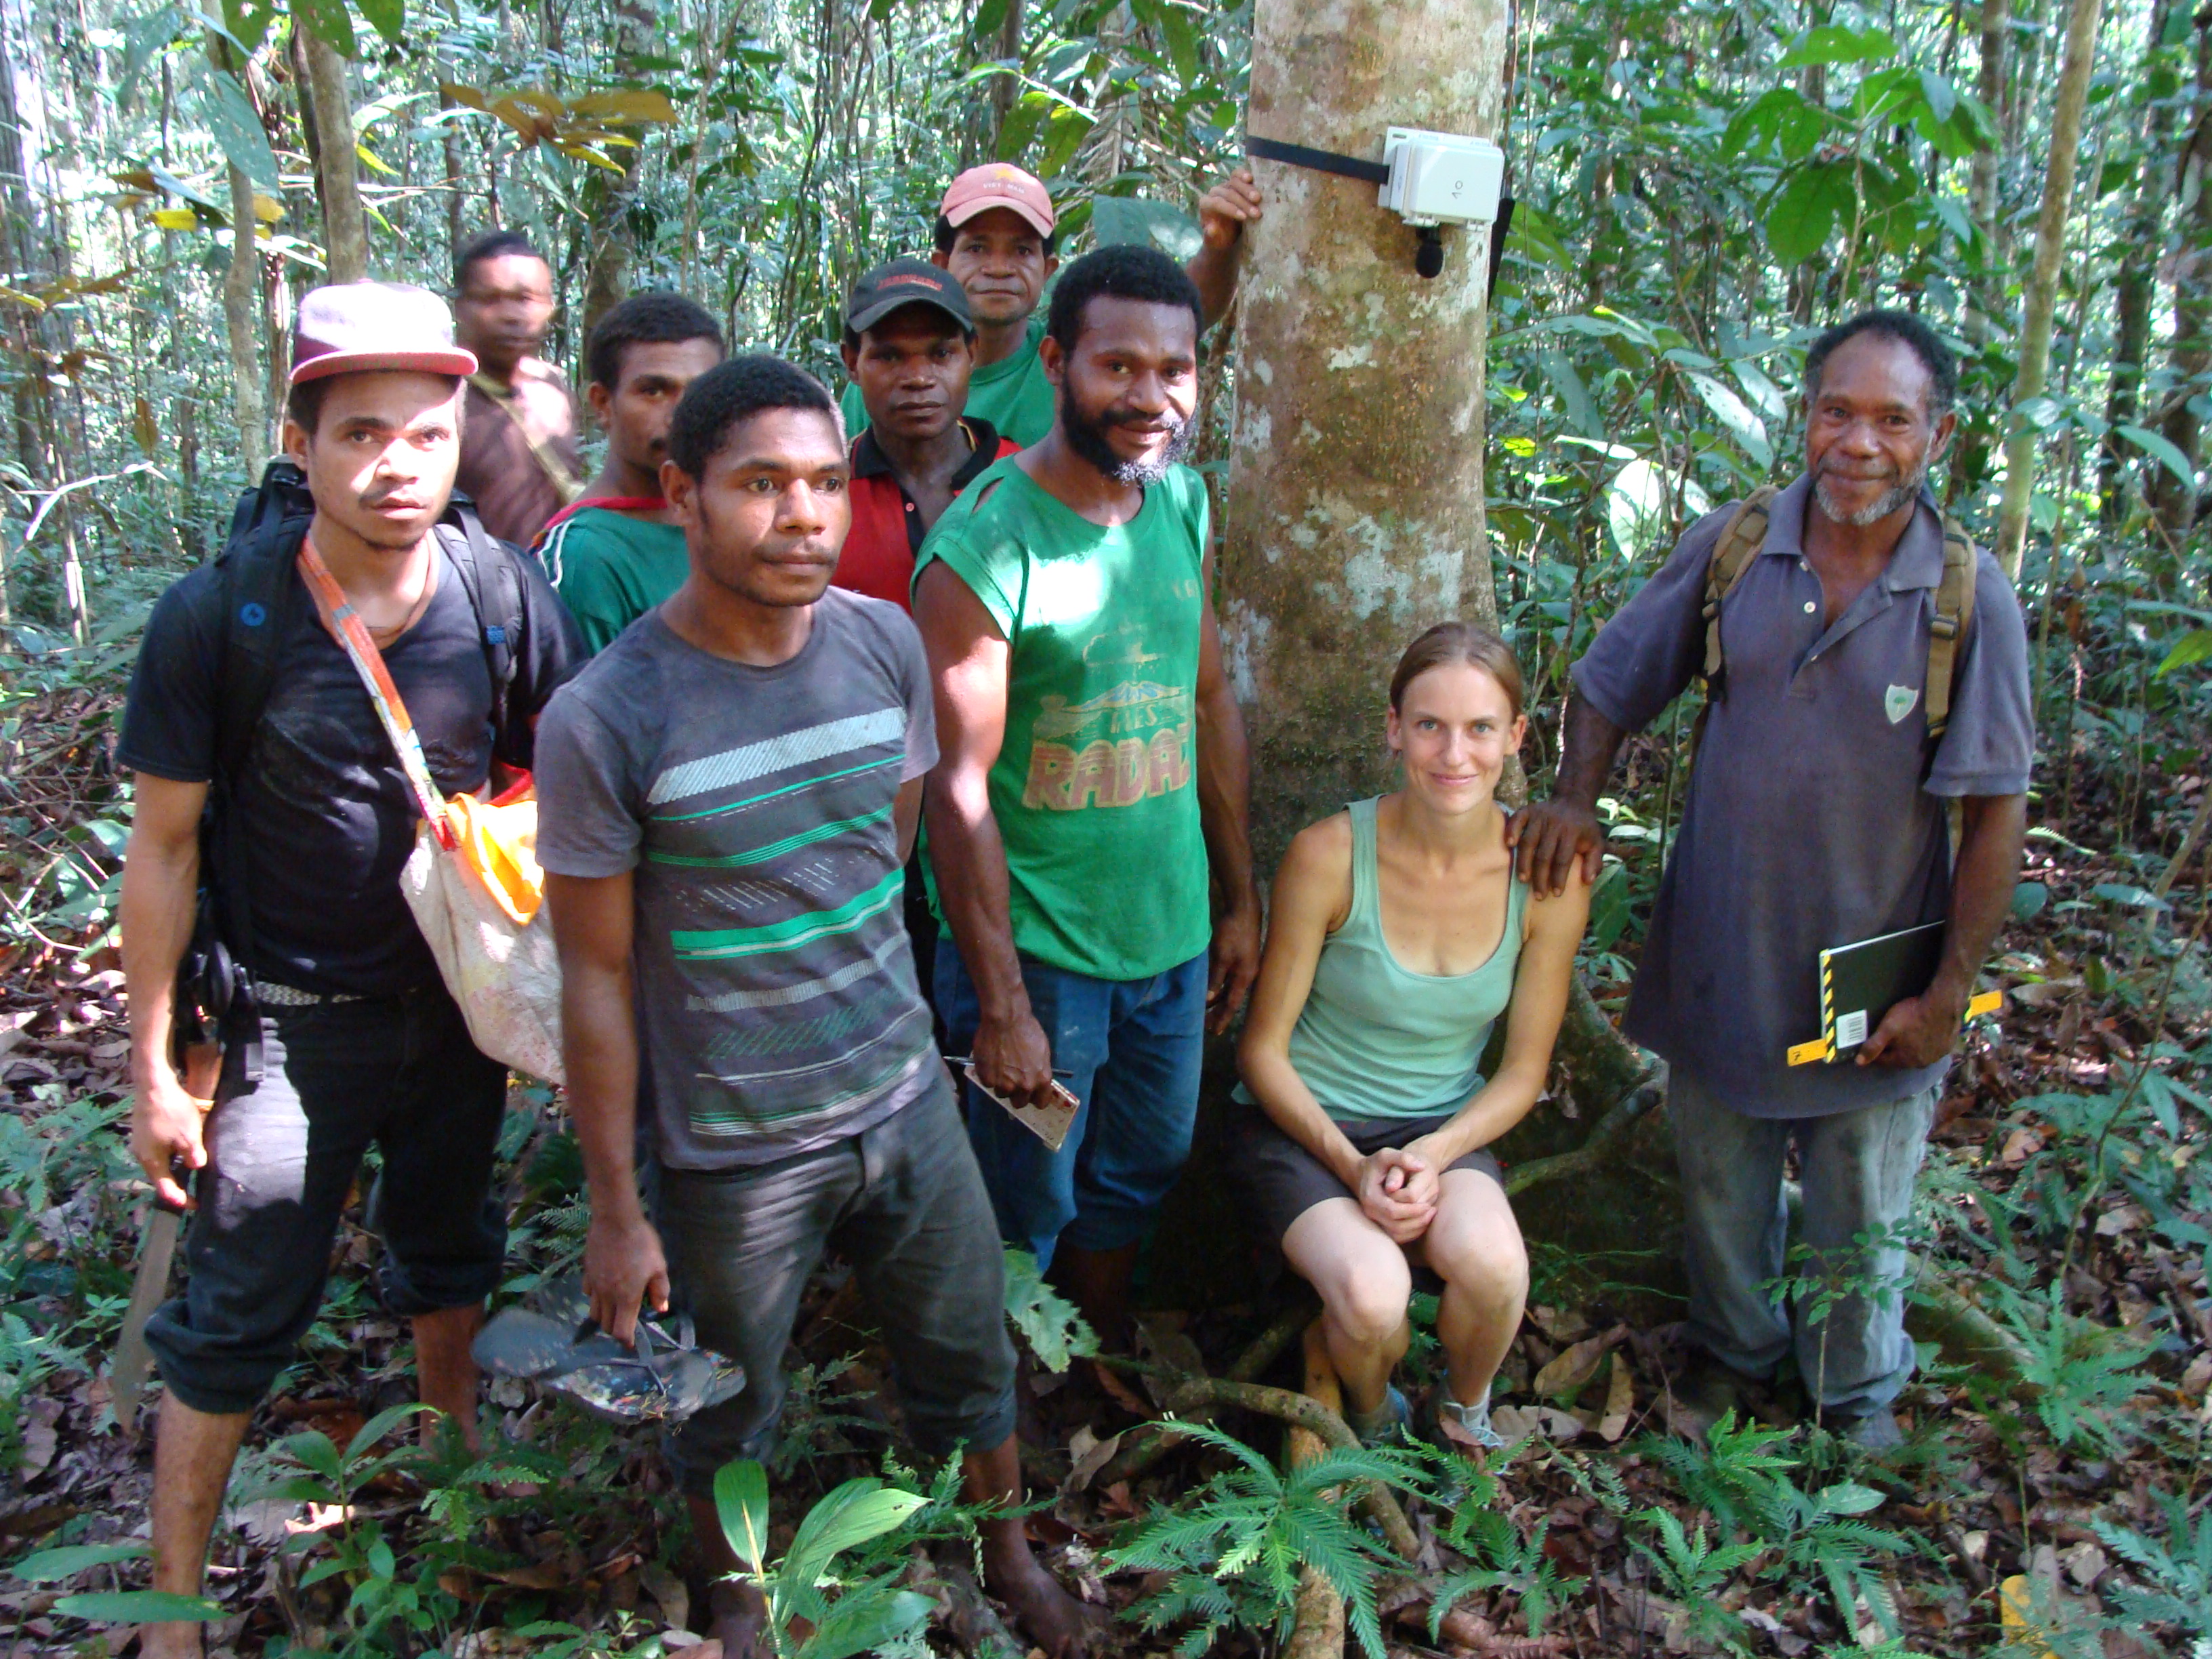
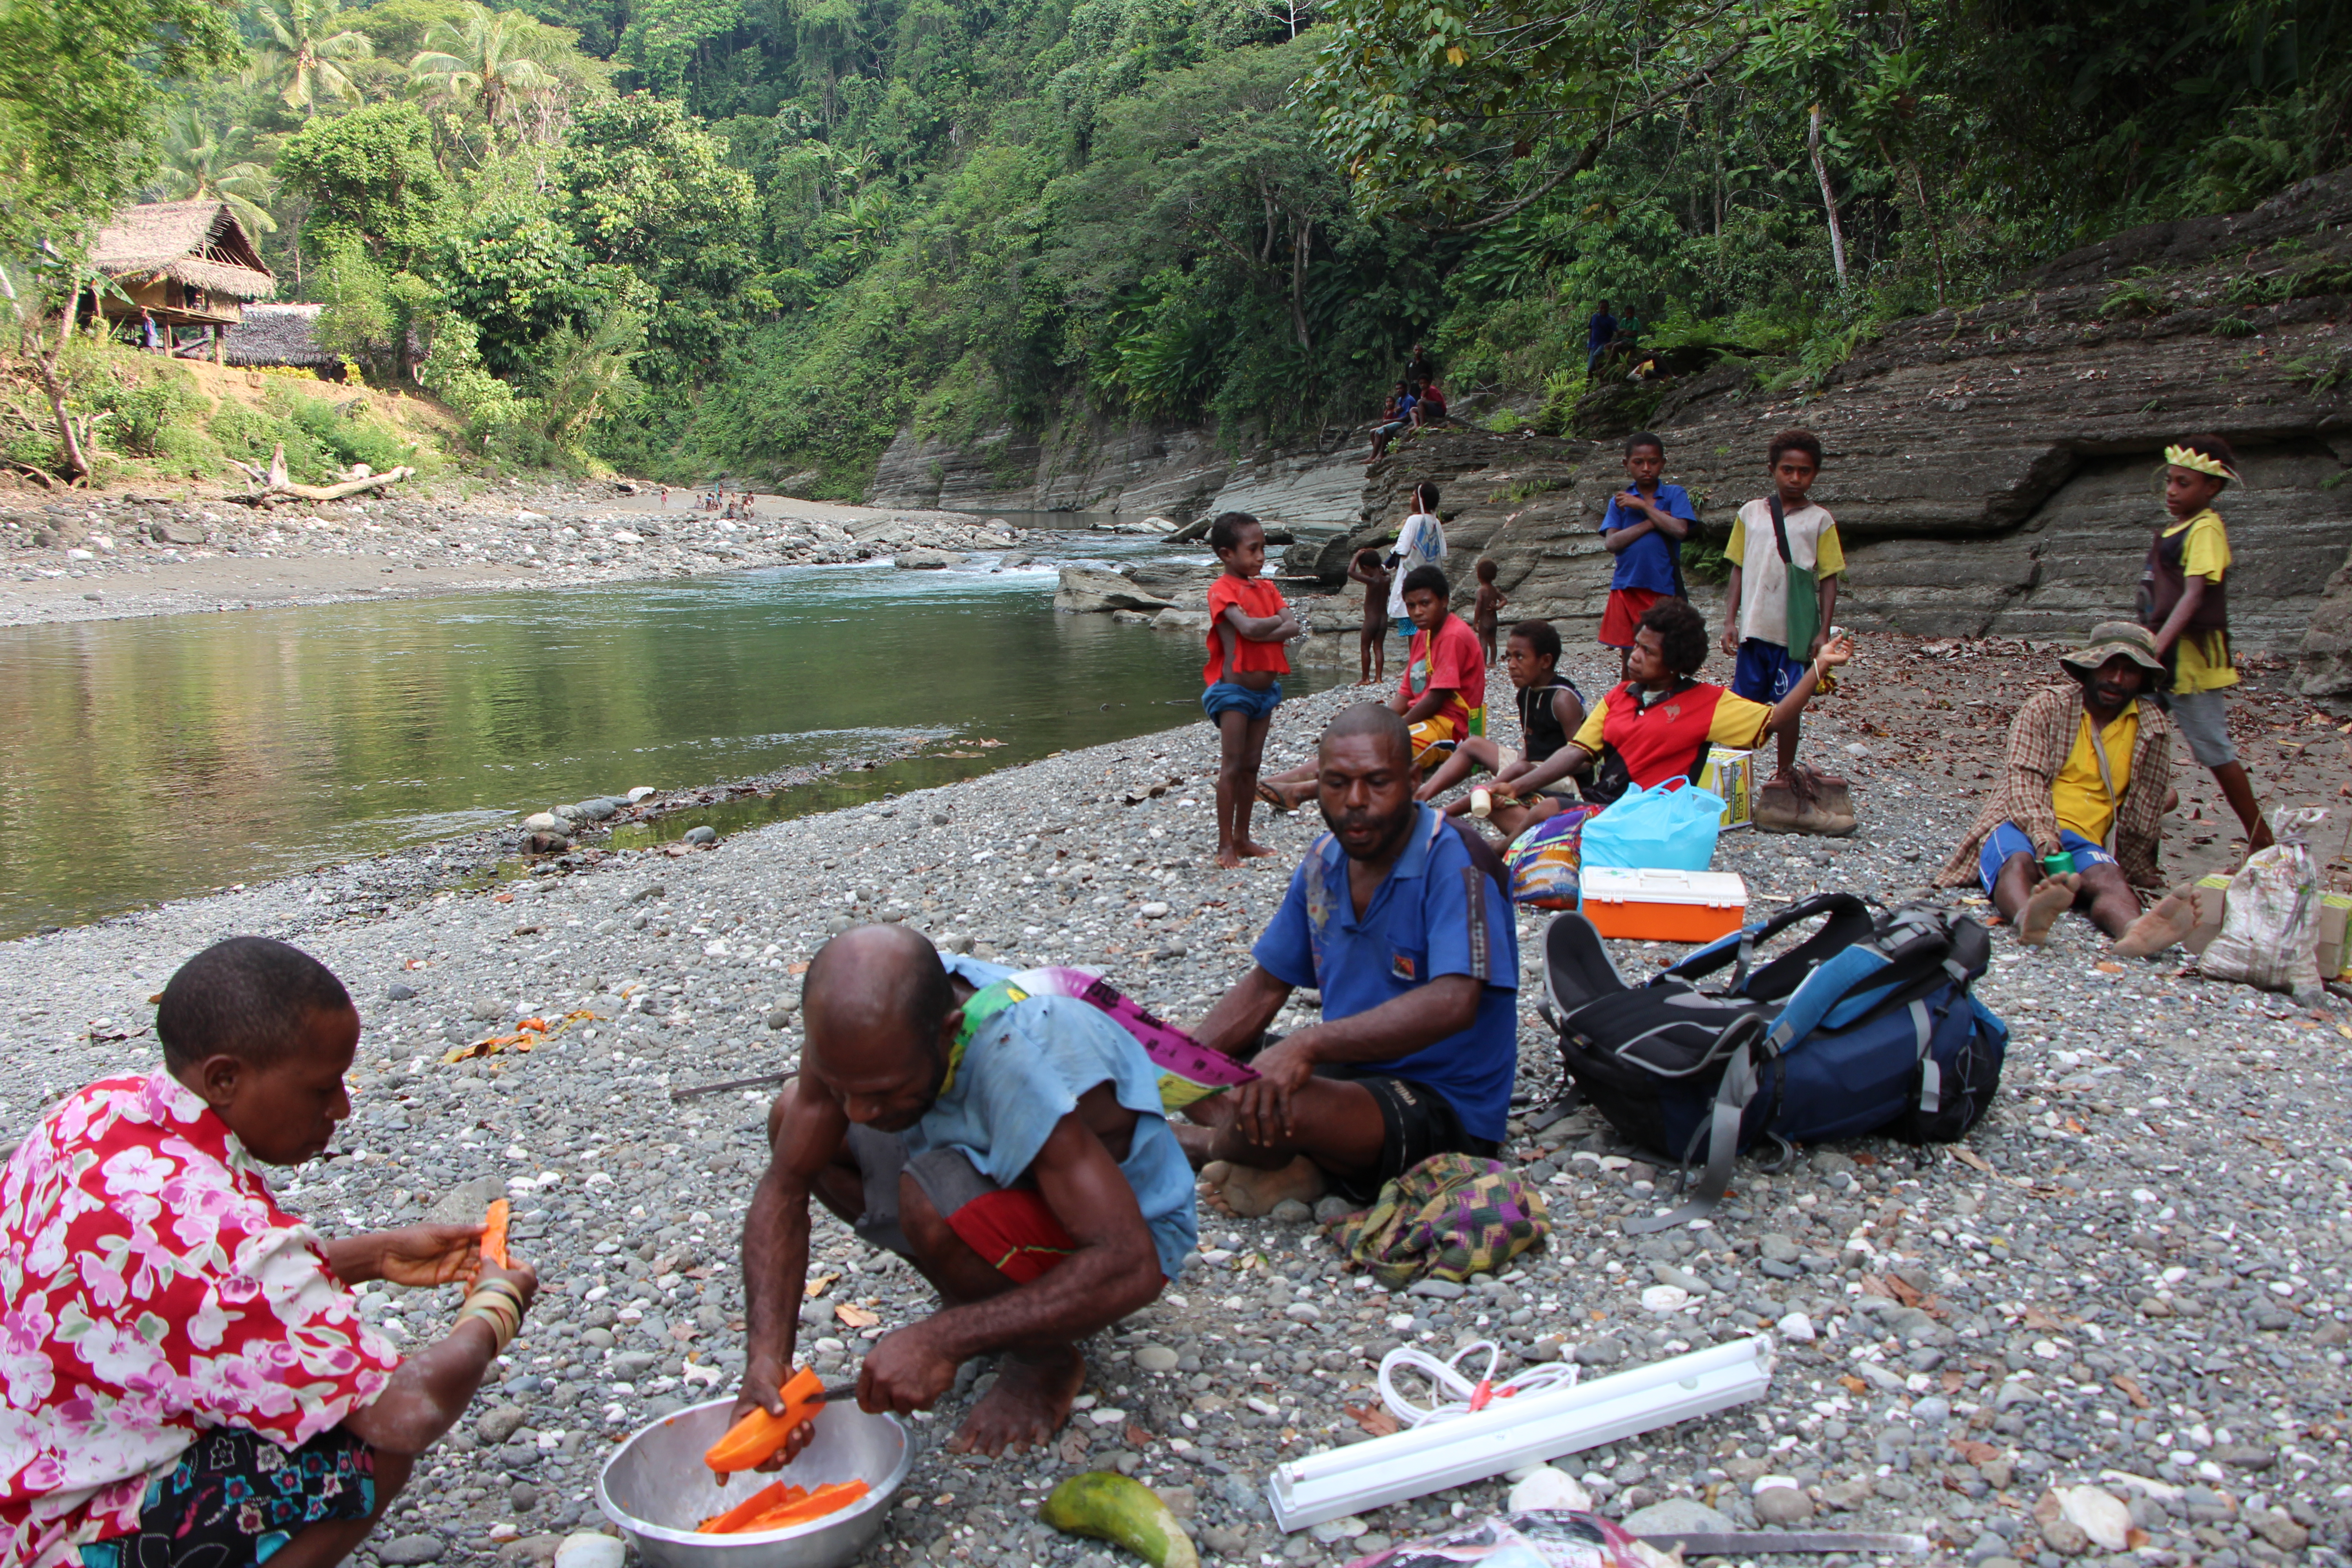
But both communities and conservationists needed a way to evaluate their efforts, before the national government considered expanding the program beyond Madang province. So in July 2015, Game and two other scientists, Zuzana Burivalova and Timothy Boucher, spent two weeks gathering data in the Adelbert Mountains, a rugged lowland mountain range in Papua New Guinea’s Madang province.
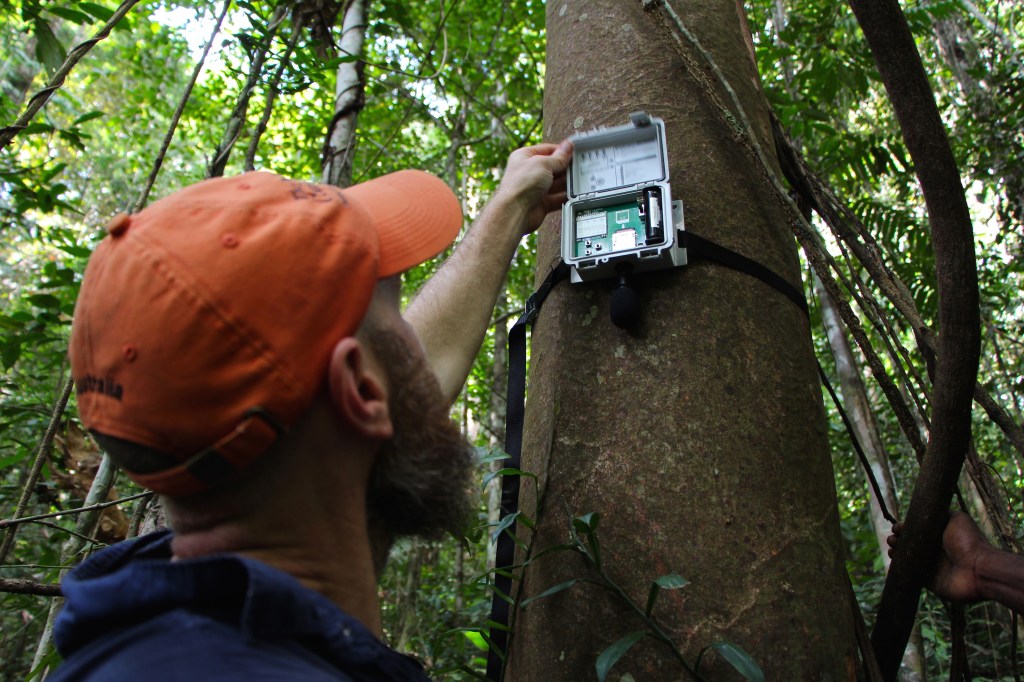
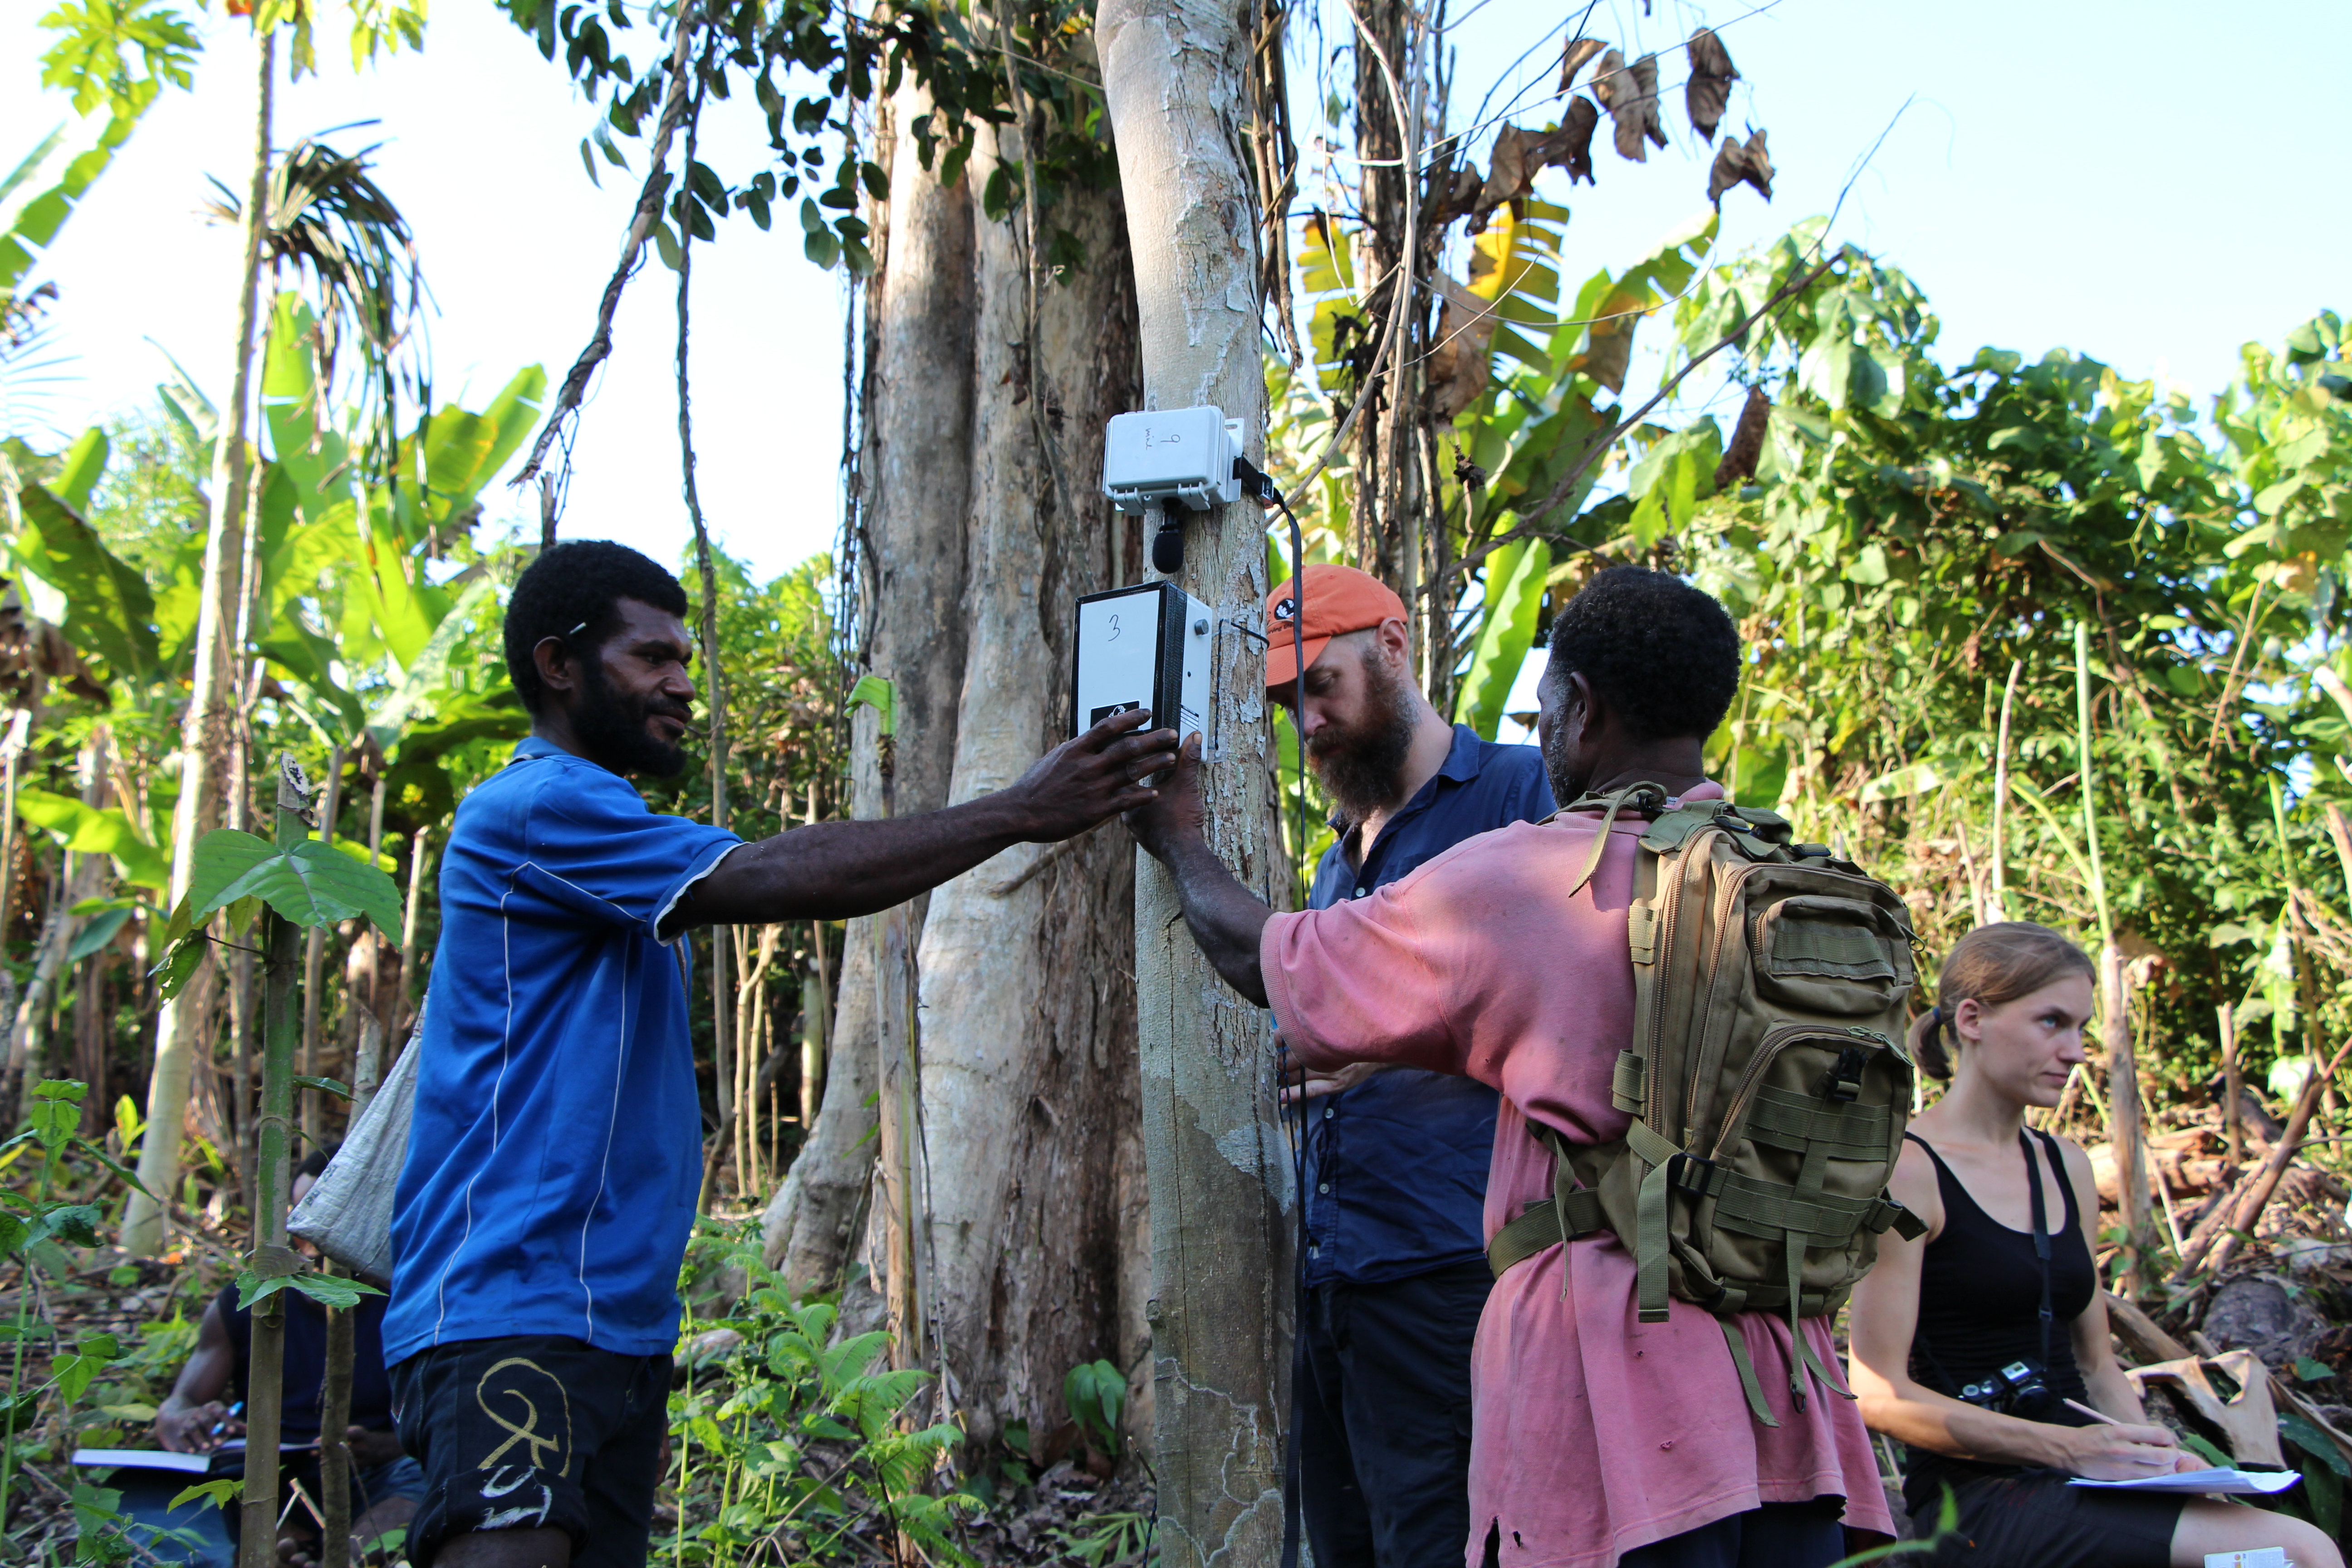
Working with conservation rangers from Musiamunat, Yavera, and Iwarame communities, the research team tested an innovative method — acoustic sampling — to measure biodiversity across the community forests. Game and his team used small acoustic recorders placed throughout the forest to record 24-hours of sound from locations in each of the different land zones.
Soundscapes from healthy, biodiverse forests are more complex, so the scientists hoped that these recordings would show if parts of the community forests, like the conservation zones, were more biodiverse than others. “Acoustic recordings won’t pick up every species, but we don’t need that level of detail to know if a forest is healthy,” explains Boucher, a conservation geographer with the Conservancy.
From Spectrograms to Soundscape Saturation
Two weeks in the forest yielded recordings from 34 sites across 20 square miles of remote rainforest — a vast amount of audio data. To get from raw data to a rough measure of biodiversity, the research team partnered with the Queensland University of Technology’s ecoacoustics research group.
“We need to create a method to understand what was in the data without listening to it, and the best way to do that is with a picture,” explains Anthony Truskinger, a research software engineer at QUT.
Sound is all about acoustic energy. “Humans think about that as loudness, but it’s not really loudness,” says Game. “It’s just how much energy the sound waves have when they hit you.” Using combination of specialized statistics that measure different aspects of acoustic energy, Truskinger and his colleagues were able to manipulate the sound data into images that show a full 24-hours of data in a single image.
Each column represents a single minute of data, and the colors in different rows indicate which audio frequencies are occupied, or filled, throughout that minute. “We were interested in soundscape saturation, which basically means how much of the bandwidth at any giving moment is occupied by sound,” explains Zuzana Burivalova, a tropical ecologist and postdoc at Princeton University. “It tells us how many different types of sound there are.”
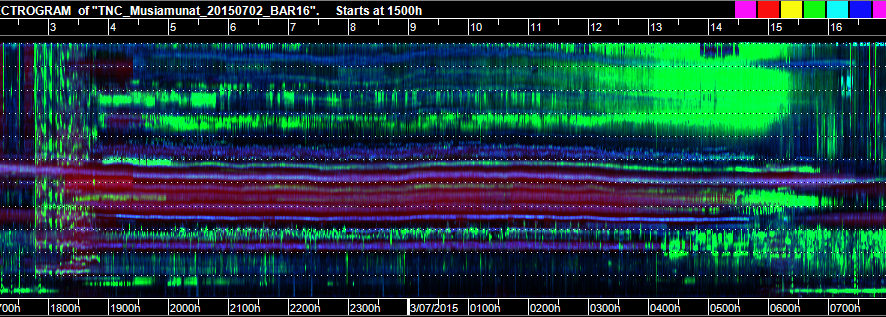
The team’s results, published recently in Conservation Biology, showed that soundscape saturation levels were similar across sites, with one exception. “We noticed a real difference during two crucial parts of the day — early morning when the birds start singing and insects are out, and then again in early evening.”
But they still needed to understand what was driving those differences in the dawn and dusk choruses, because the data were not collected in a perfectly controlled experiment: recordings were taken on different days and sites differed in forest cover, altitude, temperature, slope, and size of the land-use zone. So Burivalova designed a statistical analysis to untangle these variables and identify exactly what was driving the differences in the dawn and dusk choruses.
“The single most important explanation seems to be whether the forest is fragmented or not,” says Burivalova. Altitude also played a role — to a lesser degree — with higher-altitude sites having a more saturated soundscape.
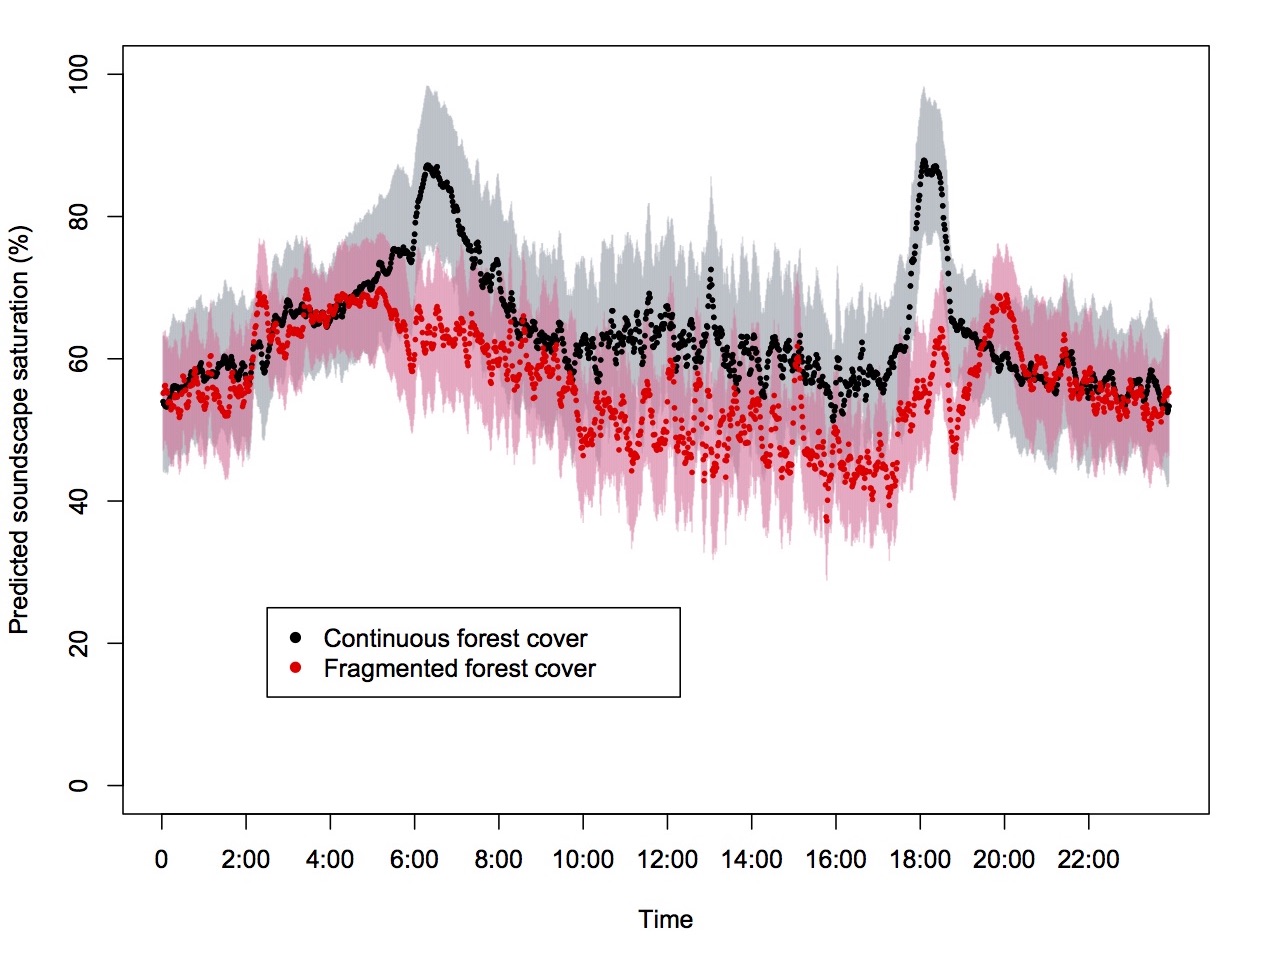
Game says he was surprised that the continuous forest was so different to the fragmented forest, because a lot of surveys of birds — some of the dominant vocalizers — tend to show bird diversity holding steady, or even increasing, in fragmented forests. “But the acoustic method is picking up differences in biodiversity that we might not see if we’re just counting birds,” he says. “Clearly the soundscape is not as rich at fragmented sites, which is suggestive to us that it’s not as diverse.”
Bryan Pijanowski, an acoustic ecologist at Purdue University, says that these results are a solid use of applying new technologies to the problem of assessing changes in biodiversity over time and space. “The conclusions that relate maximum amount and complexity of biological sounds as a theoretical, natural level of biodiversity is rather new,” he says, “but it is also very consistent with other studies that demonstrate a strong relationship between quality of the environment and some measure of biological sound-source complexity.”
The acoustic method is picking up differences in biodiversity that we might not see if we were just counting birds.
Eddie Game
A Key Tool for Community Conservation
For the Nature Conservancy, Game, Burivalova, and Boucher’s results offer strong evidence that the land-use plans are achieving tangible conservation outcomes. “Clearly the areas that the communities are setting aside and not cutting trees are quantitatively and qualitatively different from areas they are using,” says Game “and we can see a different and richer biodiversity.”
Encouragingly, the varying size of the different zones had no effect on the soundscape. “That’s strong support for the value and effectiveness of the community work that the Adelbert communities have been doing with support of the Conservancy,” says Game.
Beyond the Adelbert’s communities, Game hopes that acoustic analysis could provide a new tool to expand both sustainable financing and conservation funding to local communities. “People who might invest in forests want simple measures of whether or not a conservation project is effective,” says Game. “And that’s been a huge challenge for small communities, because then you need additional philanthropic support and technological support to do that kind of monitoring.”
Yet acoustic analyses like this one require minimal specialist expertise to collect the data… meaning they could be a cost-effective tool for small groups or communities to monitor their forest resources in an objective and scientific way.
And in a place where conservation happens village by village, that could make all the difference.


I’m a middle school teacher in the Bronx and wonder how I might be able to access these sounds to play to my students in the classroom.
I do agree that acoustic based identification is a better solution in dense canopy. I have published articles on this subject. http://www.biodiversityfriends.com