Calculating forest carbon emissions just got easier — Nature Conservancy scientists have devised a new way to bring together global, regional, and local carbon emissions datasests on deforestation and degradation, including a way to account for the uncertainty behind this tricky data mash-up.
Building Baselines for Historic Emissions
In the wake of the 2015 Paris Climate Conference, 195 countries committed to become carbon neutral by the end of the century. And the first step to becoming carbon neutral is to figure out baseline emissions.
“It sounds technical, but baselines are critical to demonstrating to the world that you are actually doing something that is making difference in the amount of carbon in the atmosphere,” says Peter Ellis, a forest carbon scientist at The Nature Conservancy and co-author on the research.
Adding Degradation Into the Equation
Berau’s 1.6 million hectares of forests are among the world’s highest in biodiversity, carbon density, and sequestration potential, but only 17 percent are under formal protection ⎯ the rest are allocated to commercial logging, timber plantations, palm oil plantations, coal mines and settlements.
“Indonesia is the next big story in tropical deforestation,” says Bronson Griscom, the Conservancy’s director of forest carbon science and lead author on the research. The Conservancy has supported the government of Berau to establish the Berau Forest Carbon Program, a REDD+ demonstration project that will provide compensation to local people for forest management that reduces deforestation and its related carbon emissions.
Carbon accounting is complicated. Calculating baselines for when, where, and how much carbon is emitted, stored, or sequestered from different land uses, even in a relatively small geographic area like Berau, is a mathematics exercise on a massive scale.
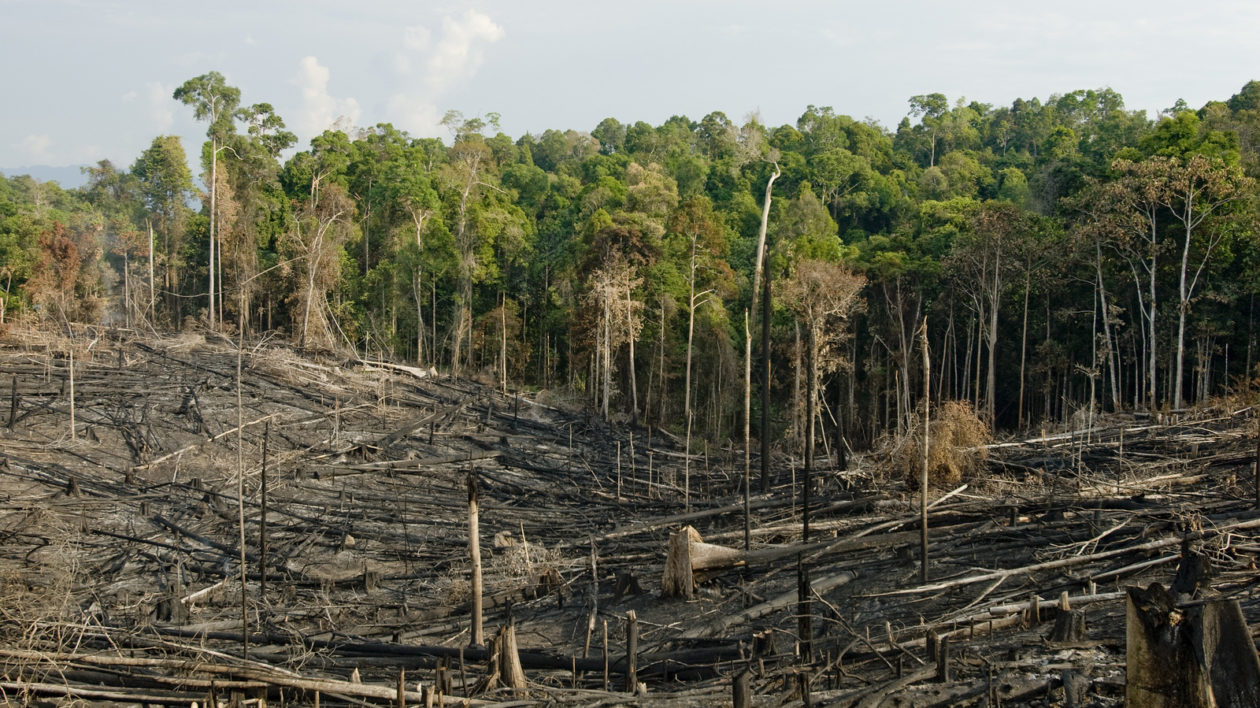
First, Griscom, Ellis and co-authors combined forest area change data, which shows how much forest is gained or lost each year, with a biomass map, which shows how much carbon is stored in the landscape per hectare. Together, they used those figures to estimate Berau’s net carbon emissions from deforestation between 2000 and 2010. But there’s a third piece of the puzzle that’s often missing from the emissions equation: forest degradation.
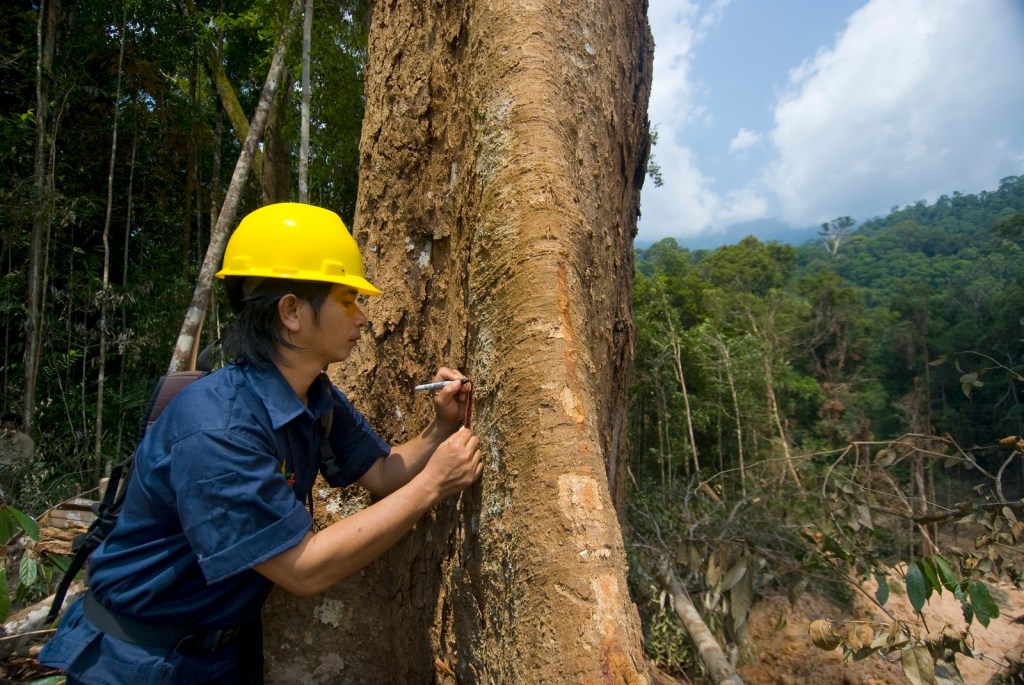
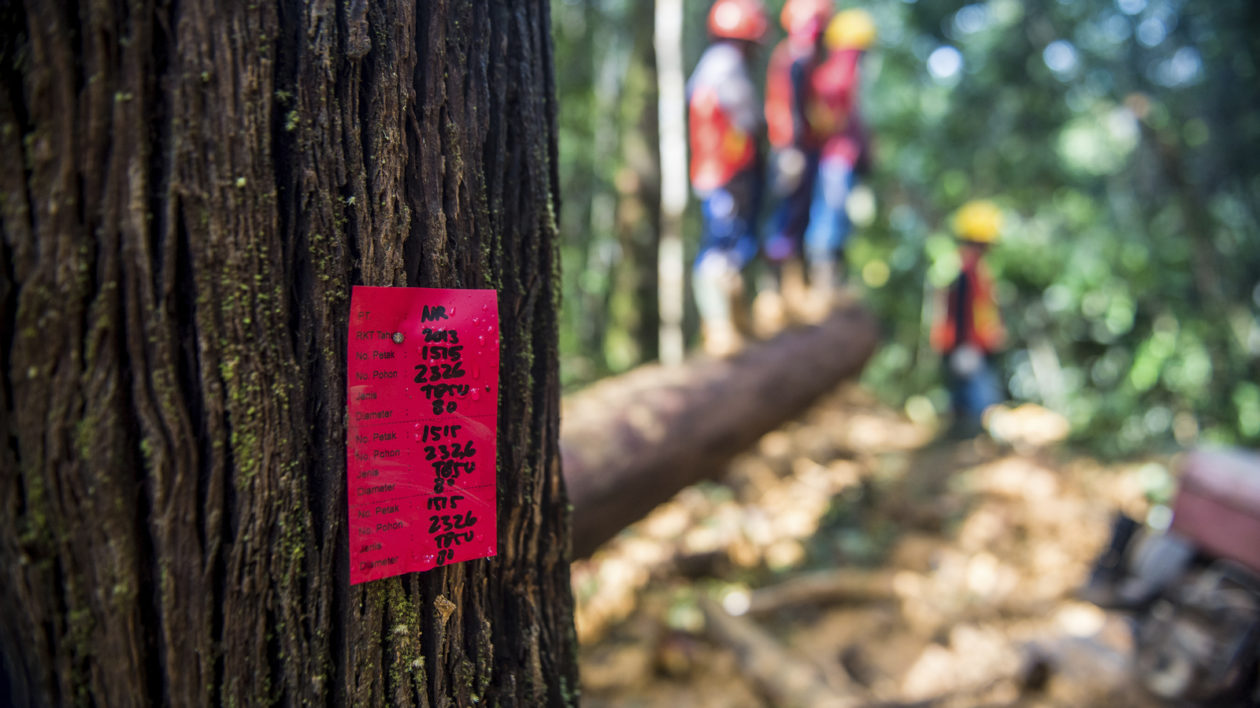
Many logging companies target and remove only the most valuable trees in the forest, a process known as selective logging. Though less destructive than clear-cutting, selective logging still causes enough collateral damage to change the forest significantly.
“Those changes are really dramatic on the ground,” says Griscom, “but they actually don’t register as forest loss on a satellite image.”
To accurately factor degradation into the equation, Ellis and Griscom had to start from scratch. “We spent a lot of time bouncing around in trucks to get to these remote, far-flung logging concessions deep in the heart of Borneo,” says Griscom. “There, we built on work by partners to create a customized, efficient forest sampling procedure that is now embedded in a new methodology for ground-based monitoring of logging impacts.” (Read more about their work here.)
With all three elements in place, they calculated that Berau generated 8.91 ± 1.99 million tonnes of net carbon dioxide emissions each year from 2000 to 2010 — 12 times higher than gross sequestration. The majority of net emissions were caused by conversion of native forests to agriculture (43 percent) and oil palm (28 percent), and legal commercial selective logging (17 percent).
The Importance of Uncertainty
Accounting for land-based carbon storage, emissions, and sequestration is inherently tricky, and that challenge is compounded by a notorious lack of transparency. “Countries, including the United States, use the land sector as a loophole in their accounting system,” says Griscom.
Understanding uncertainty is the key to closing that loophole. “Anyone can set a baseline,” says Ellis, “but that number isn’t any good unless you have an estimate of the uncertainly around it, which tells how much you can trust that number.”
Ellis and Griscom calculated the uncertainty for each variable in their carbon equation to estimate the uncertainty of their original figure, making this the first forest carbon flux study they know of to quantify uncertainty across all variables. That range revealed some interesting comparisons with other forest carbon estimates for Berau: Estimates from other studies that have been used in preliminary national reporting are well above the upper error bar of Griscom and Ellis’s new figure.
“This is exactly why estimating uncertainty is so important,” says Ellis. “There are multiple datasets and multiple ways to calculate emissions, so tracking uncertainty will provide countries like Indonesia a comprehensive benchmark for refining their own emissions estimates.” Indonesia is actively working to improve their emissions estimates for Berau, and they hope that including this uncertainty estimate will help Indonesian scientists identify a reasonable range for improved national estimates that are supported by independent scientific studies.
Better emissions estimates will ultimately lead to more successful conservation. “Carbon accounting helps us implement more effective conservation activities,” says Ellis, “and it also helps us measuring the performance of those actions. We can’t succeed in saving the planet until we can measure success.”
Join the Discussion
2 comments