
Conservationists: Wouldn’t it be cool to have a Consumer Reports-like review to help you decide how and where to act? Those little filled or half-filled circles make it so easy to compare quality, durability, ease-of-use and price ranking for cars, toasters, and dishwashers.
Well, we might be getting close: Nature Conservancy scientists have developed an approach that makes it almost as easy to see the trade-offs between, say, the importance of biodiversity saved or the value of watershed protection, and the cost of implementation and the likelihood of success for a conservation effort.
The project, described in a recent article in the journal Biological Conservation, was the first to compare terrestrial, freshwater and coastal habitats in the same analysis and helped inform the Conservancy’s recent decision to establish a new conservation program in Gabon.
“When we started this process we had a really simple question,” says Matt Brown, the Conservancy’s director of conservation for Africa, “where will TNC investments offer us the best return? Today we continue to use this priority setting to help inform our decision making and to help partners and donors understand the significance of our site selections.”
A New Calculation Offers Transparency and Flexibility
Using data to prioritize conservation investments isn’t a new idea. But the return-on-investment (ROI) framework described in the paper adds several elements that make the process more comprehensive, flexible, transparent, and (the authors hope) ultimately more useful — especially in a region known for political and economic instability. It also takes advantage of new sources of geographic data developed in the past decade.
Conservation ROI in its simplest form is just:
(Benefit of an action * Probability action will succeed) / Cost of Action
This simple formula — with a whole lot of data behind it — allows a straightforward comparison across all the countries and ecoregions of the continent.
While it may sound a little cold and actuarial, the process of explicitly assigning costs and values can push conservation managers to clearly articulate the personal biases that otherwise remain unspoken. This kind of transparency is a big asset — allowing the people most affected by the action to question, challenge and, potentially, revise the recommendation and the logic behind it.
The concept of return-on-investment is borrowed from business, where the ‘return’ is almost always measured in dollars. When applying the concept to conservation, there may not be a direct financial payoff, so it’s important to decide just what kind of benefit will count. In this case, the authors chose biological distinctiveness: How unusual are the species, ecosystems and assemblages represented in a region? But they could have chosen a different kind of benefit, such as number of endangered species or water sources protected.
Straightforward Comparison, Grounded in Data
The authors had to find a source of data for each term in the equation that would be comparable across each of the countries or ecoregions of the continent. For conservation benefit, they used the Biological Distinctiveness Index (BDI) — assembled by WWF researchers — together with an index of the present condition of habitat and management status.
Knowing that corruption and economic deprivation are major obstacles to conservation success anywhere in the world, the team chose the Ibrahim Index of African Governance (IIAG) to represent probability of success. The national index is updated annually with information on safety and rule of law, participation and human rights, sustainable economic opportunity, and human development.
The authors represented costs in two different ways – the cost of managing a protected area (for terrestrial and marine areas) and the value of agriculture that a newly established conservation area would displace (for terrestrial and freshwater habitats).
Same Data, Different Perspectives
With the data assembled and the equations calculated, the authors took a look at the outcomes from a couple of different angles. At the country level – where the Conservancy needs to make decisions about investment and where government decisions about protected areas are made — they focused on high ROI areas for each type of habitat (terrestrial, freshwater and coastal marine).
Gabon stood out as having good opportunities for both terrestrial and freshwater conservation at modest cost, with a strong probability of success. “This result of the paper was borne out in practice, once the Conservancy began investing in Gabon,” said Colin Apse, the Conservancy’s freshwater conservation advisor for Africa, “as there are in fact very few places in the country where industrial agriculture is or is likely to compete with conservation management in the coming decade.”
With the right data, the approach can be applied across a range of scales — from choosing between conservation approaches on an existing reserve or within a country to setting continent-wide, or even global, conservation priorities. “After doing the ROI portion of this analysis, I have been looking for other applications as the principles are so simple,” said Tim Tear, now managing director of the Grumeti Fund. “I was able to use it to compare different black rhino translocation options – which is of course at a completely different scale than in this continental analysis. I have found it a useful tool to have in my toolbox.”
The ROI approach also revealed a few conservation opportunities — in such countries as Angola and Congo — that would not have turned up under the typical analysis, in which biodiversity provides the first filter and cost and probability of success come later.
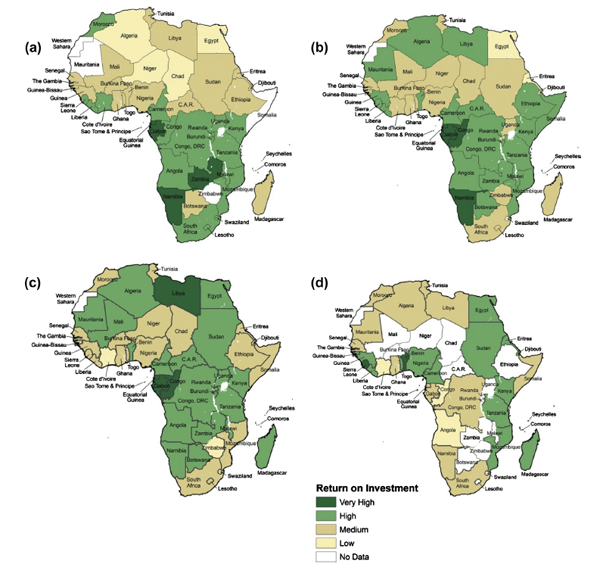
freshwater (using opportunity costs), and (d) coastal marine (using management costs). Credit: T.H. Tear et al. / Biological Conservation 173 (2014) 42–52
Global Priorities
Zooming out to look at potential global priorities, the researchers looked for areas where good terrestrial opportunities were located next to — or overlapped with — promising marine and freshwater sites.
Such opportunities often cross national boundaries — such as the overlapping freshwater and terrestrial prospects of the Great Lakes region, which has portions in Tanzania, the Democratic Republic of Congo, Zambia and Malawi, or the Nigeria to Gabon coastal region.
These areas require international cooperation to protect effectively. But the proximity of highly valued ecosystem types gives a lot of bang for the conservation buck.
“What I think is cool is that the data really show how special these areas are,” said Tear. “It is not based on personal preference or expert opinion. These places pop out from many different perspectives. They really are global conservation priorities.”


Join the Discussion